What is the Salienz Score?
The Salienz Score is a number from 0 to 100 for how strongly AI assistants recommend a brand to buyers in its category. Most trackers count how often a brand is mentioned. This one asks what a buyer would ask: when people go to an AI for advice, how often does it point them to you, and how firmly? A score of 10 means your recommendations add up to being the correct top pick in 10 of every 100 relevant answers.
Why is a mention not a recommendation?
Because most trackers give the same credit to being named the best fit and being buried under 'others include'. Both count as one mention. A buyer reads them very differently, and the number that claims to describe what the buyer saw should too.
| What the AI does with you | Mention rate or share of voice | Salienz Score |
|---|---|---|
| Names you the top pick | One mention | 1.0 points |
| Puts you in a short list of five or fewer | One mention | 0.7 points |
| Mentions you in passing | One mention | 0.15 points |
| Names you and gets a major fact wrong | One mention | Half the points |
| Warns buyers away from you | One mention | -0.5 points |
Position in the answer does not rescue the mention count either. In January 2026, SparkToro and Gumshoe published a study in which 600 volunteers ran 12 prompts through ChatGPT, Claude and Google's AI, 2,961 runs in all. ChatGPT and Google's AI each returned the same list of brands less than once in 100 runs, and the same list in the same order less than once in 1,000. 12 How often a brand appeared held up far better than where it ranked.
Small samples mislead for the same reason. In our tests, two readings of the same unchanged market could sit 7.7 points apart through noise alone when each was built on 160 answers. At 8,000 answers each, the gap shrank to about 1.1 points. 3 Visibility numbers also rarely get checked against pipeline at all, and this one is built so that it can be.
How is each AI answer graded?
Every answer earns points for what the assistant does with the brand, from 1.0 for naming it the top pick down to minus 0.5 for warning buyers away. The scale has six steps, and we apply it to every brand in the category the same way, the client included.
| What the AI does with you | Points |
|---|---|
| Names you the top pick | 1.0 |
| Recommends you in a short list of five or fewer | 0.7 |
| Lists you neutrally, or in a longer list | 0.4 |
| Mentions you in passing | 0.15 |
| Cites your site but never names you | 0.05 |
| Warns buyers away from you | -0.5 |
Wrong facts reduce the points. A minor error multiplies them by 0.8. A major error, being confused with another company, or appearing only under an old name multiplies them by 0.5. A warning always stays negative.
The grading is blind. The AI model that reads each answer is never told which brand is the client, two models grade, and a person audits a sample every month. In testing, a grader that nudged the client's answers up one step, one time in ten, produced a fake gain in 42 percent of markets. A blind grader did so in 4 percent, close to what noise alone produces.
Which questions count, and how are they weighted?
Questions come from demand signals: search volume, Search Console and sales calls. A question is included when the brand would be a fair answer to it. Questions that already name the brand, such as 'Salienz vs X', do not count toward the score and are tracked separately, since being found by someone who already knows your name says little about being discovered.
Each question is asked many times across the assistants buyers use, in clean logged-out sessions in the client's market. That adds up to thousands of answers a month. How the question set itself is built is covered in how Salienz works.
- Questions people ask more often count more. The scale is compressed so one huge query cannot swamp everything else.
- Assistants your buyers use more count more.
- If an assistant shows no AI answer at all, which often happens with Google's AI Overviews, that is not held against you.
- If it answers and names nobody, that counts as a real zero.
How does the score split into Presence and Preference?
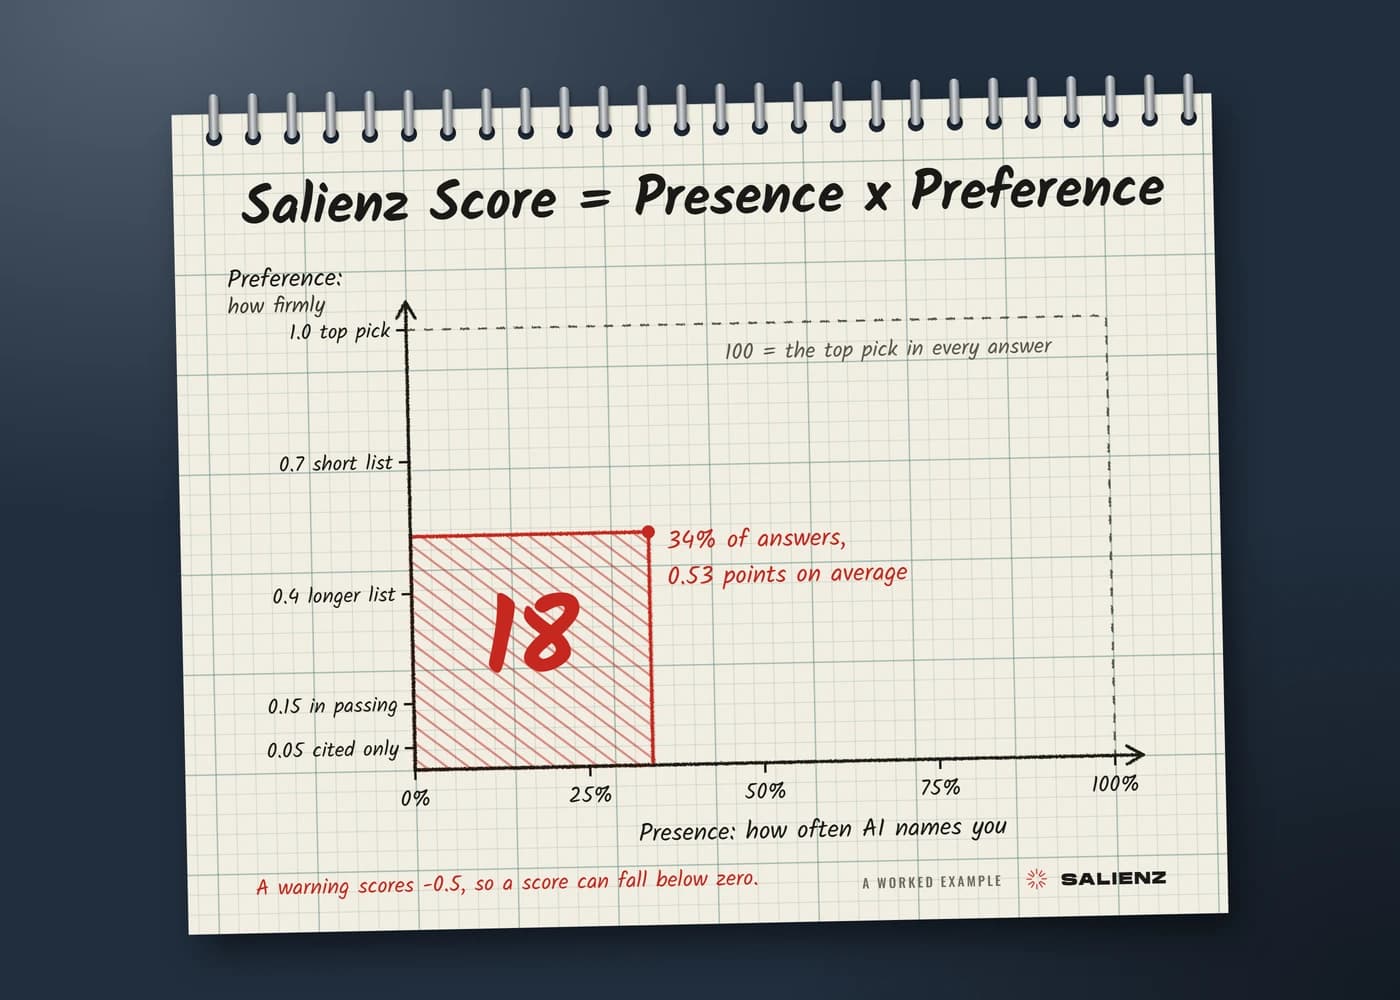
The Salienz Score is Presence multiplied by Preference. Presence is how often AI names or cites you at all, which is the visibility number most reports stop at. Preference is how strongly it recommends you when it does. A brand that appears in 34 percent of answers with an average of 0.53 points scores 34 times 0.53, which is 18.
The split is what tells you what to do next. If the score falls while Presence holds, the assistants still name you and recommend you less firmly. If Presence falls while Preference holds, you are being left out of answers. The score can also drop below zero when warnings outweigh recommendations, and 100 would mean the correct top pick every time.
How do you know a change is real and not model randomness?
Every Salienz Score comes with a 95 percent range, and the same question set is run twice to measure normal noise. In testing at 8,000 answers a month, that range averaged 0.8 of a point either way, and a month-to-month move for the brand under test had to pass about 1.4 points before it stood outside normal noise. Four more checks sit behind that range.
- Net movement is measured within each assistant. Your share of recommendations is compared with the category's inside one assistant, then the results are combined, so a model update that hits every brand does not look like your win or loss. When one assistant turned cooler towards every brand in testing, the raw score raised a false alarm in 63 percent of markets and the net figure in 9 percent.
- About 10 percent of questions are held out and never shared with the content team. If tracked questions improve and held-out ones do not, the gains are not real. In our tests, content written only for the tracked questions lifted the score on them by a median of 14 points and left the held-out questions flat.
- The grading is blind, as described above.
- Every brand the assistants name is tracked, not a hand-picked competitor list.
What does the score do with rebrands, look-alike names and long lists?
The score has a rule for each case that a plain count gets wrong.
- Look-alike or common-word names: only the real company counts.
- Rebrands: mentions under the old name get half credit, and the score tracks how fast the new name takes over. Salienz went through this itself when it changed its name in September 2026.
- 'Best for X' answers count as a top pick only when X matches the buyer who is asking.
- Sponsored placements are excluded.
- Fifteen-brand dumps are worth little to anyone on the list.
- Categories where AI names nobody are reported as open space, not as a zero.
Why is the Salienz Score better than a mention rate or share of voice?
Because the standard metrics count appearances, and buyers act on recommendations. A mention rate is the share of answers that name you. Share of voice is your slice of all the brand mentions in those answers. Neither can tell a top pick from a passing mention, and in our tests a mention rate kept showing a gain while recommendations fell.
Some trackers add an average position. The order of a list barely repeats, as the SparkToro and Gumshoe study above found, so the Salienz Score leaves position out and grades what the answer says about you. 1
We checked the difference before relying on it. On 300 simulated markets, where a simulated buyer read every answer and chose a brand, we ran the score beside copies of a common mention-rate formula and a common sentiment composite. They are copies of the formulas, not anyone's product. 3
| Test | Salienz Score | Mention rate | Sentiment composite |
|---|---|---|---|
| Ranks brands by how often buyers chose them (1 is perfect) | 0.98 | 0.93 | 0.97 |
| The same, when answer order is random | 0.98 | 0.93 | 0.97 |
| Finds the true category leader | 92% | 72% | 82% |
| Mentions up, recommendations down: flags the drop | 90% | 0%, shows a gain | 80% |
| Catches old-name confusion | 100% | 2% | 4% |
| Noise on one month's reading, 95% range | ±0.8 points | ±1.0 points | ±0.9 points |
The gap is widest where it costs a client most. When a brand was named more often and recommended less firmly, the mention rate reported a gain every time, and the score flagged the drop in 90 percent of cases. When half of a brand's appearances came back under its old name, the score caught it every time, because old-name credit is halved by rule. A mention count has nothing to mark down.
The rest of the difference is in how the number is produced. Every score carries a 95 percent range, movement is measured inside each assistant, a tenth of the questions are held out from the content team, and the grader never knows who the client is.
How should you read a Salienz Score?
Expect lower numbers than a mention rate gives you, because a mention is not a recommendation. In test markets, the middle half of category leaders scored between 35 and 45, and the middle half of mid-pack brands between 11 and 16. 3 Real categories will differ.
- Use Presence and Preference to explain why the score moved.
- Read monthly changes as directional. Judge a 90-day programme on all of its answers pooled together.
- Pipeline is still the outcome. The score is the early signal you steer by.
It is not revenue, market share, a rank tracker or a guarantee. Why analytics miss most of what an AI recommendation does to pipeline is covered in why GA4 shows almost no ChatGPT traffic, and a baseline score is part of the Foundation audit.
Which ideas does the score borrow?
Four ideas in the score came from other people's work.
- SparkToro and Gumshoe's January 2026 study on recommendation variance, for the finding that how often a brand appears is stable where its rank is not. 1
- Aggarwal and colleagues, 'GEO: Generative Engine Optimization', presented at KDD 2024, which scored visibility with an AI-judged measure covering relevance, influence, the likelihood of a click and other factors. 4
- The recommendation rate reported by some AI visibility tools, which counts the share of answers that actively recommend a brand. 5
- Holdout testing, borrowed from machine learning.
Common questions
Receipts
05 sources- 01SparkToro and Gumshoe, AI recommendation consistency studyRand Fishkin of SparkToro with Patrick O'Donnell of Gumshoe, published January 2026. 600 volunteers ran 12 prompts through ChatGPT, Claude and Google's AI, 2,961 runs in all. Source of the same brand list returning less than 1 percent of the time, the same list in the same order less than 0.1 percent of the time, and visibility percentage holding up better than ranking position.Last checked 5 October 2026
- 02Search Engine Journal, report of the SparkToro studyPublished 30 January 2026. Used, with MediaPost's report of 28 January, to confirm the study's figures: 600 volunteers, 12 prompts, 2,961 runs, the same brand list less than 1 percent of the time on ChatGPT and on Google's AI, the same list in the same order less than 0.1 percent of the time, and visibility percentage being more consistent than ranking position.Last checked 5 October 2026
- 03Salienz's own tests of the scoreRun on 5 October 2026: 300 simulated markets of 15 brands, 40 questions and four assistants each, 8,000 answers a month, with a simulated buyer as the known truth. The buyer model assumes that how an assistant frames a brand affects which brand a buyer picks. The score ran beside copies of a common mention-rate formula and a common sentiment composite. Source of every test figure on this page. The brand under test was the third strongest in each market, and a change counted as flagged when it passed that brand's own 95 percent noise range. The falling-recommendations figure counts the 231 of 300 markets where buyer choice fell by more than 10 percent. Repeat runs returned the same brand list 0.3 percent of the time. Noise figures are 95 percent ranges, and the 0.8 is the average across all 15 brands. The script and its results file are kept with the site's source, so the run can be repeated. Simulated markets, not client accounts.Last checked 5 October 2026
- 04Aggarwal et al., GEO: Generative Engine OptimizationPranjal Aggarwal, Vishvak Murahari, Tanmay Rajpurohit, Ashwin Kalyan, Karthik Narasimhan and Ameet Deshpande, KDD 2024. Proposes a Subjective Impression metric, measured with an AI evaluator, covering relevance, influence, uniqueness, subjective position, subjective count, probability of clicking the citation and diversity.Last checked 5 October 2026
- 05Recommendation rate, as defined by an AI visibility toolRadarkit defines recommendation rate as how often AI assistants actively recommend a brand or product in response to relevant queries, not just mention it in passing.Last checked 5 October 2026